_edited.png)


Best Platforms for Neighborhood STR Demand and Comp Data

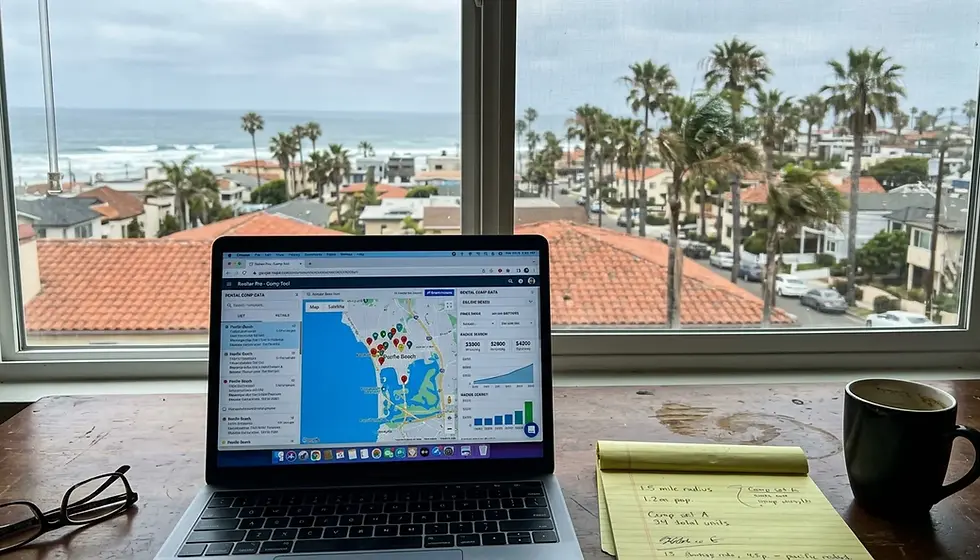
AirDNA, Key Data, Mashvisor, PriceLabs Market Dashboards, and AirROI currently provide the closest thing to true neighborhood-level demand and comp set analytics for short-term rentals, though the depth of that neighborhood granularity varies widely by platform and by market. In San Diego, where the difference between a Pacific Beach comp and a La Jolla comp can swing revenue projections by tens of thousands of dollars a year, choosing the right tool matters as much as knowing how to read it.
Key Takeaways
AirDNA's Comp Sets tool lets you build sets of up to 100 comps within a 10-mile or 15-kilometer radius, matched on bedrooms, bathrooms, and guest count, according to AirDNA's own help documentation.
Mashvisor's API documents neighborhood-level cap rate, cash-on-cash return, and STR demand endpoints, plus a dedicated comps endpoint at the ZIP-code, neighborhood, and address level.
PriceLabs Market Dashboards supports custom comp sets built with more than 40 filters and lets users save up to 30 sets, pulling Airbnb and Vrbo data within a radius of 0.1 to 50 kilometers.
San Diego carries an AirDNA Market Score Rental Demand rating of 82, and the market's active listings total approximately 15,524, with 88% classified as entire-home rentals, according to AirDNA data.
A Pacific Beach-specific dataset shows 164 booked nights per year, 45% occupancy, and a $206 average daily rate for the June 2026 to May 2026 period, roughly $37,000 in annual revenue for a typical listing.
No single platform draws a true neighborhood boundary everywhere; radius-based, ZIP-code-based, and lasso-drawn analytics are often marketed as "neighborhood-level" when they are actually broader geographic proxies.
Short-term rental owners in 2026 are drowning in dashboards that promise "market data" but rarely explain what geography that data actually covers. At West Coast Homestays, we manage properties across San Diego's coastal neighborhoods, from Pacific Beach to La Jolla to Carlsbad, and one of the most common questions we get from owners is which analytics platform actually tells them what their specific street or ZIP code is doing, not just what "San Diego" is doing on average.
That distinction matters more than most owners realize. San Diego recorded 6.7 million private-home guests in 2026, according to the San Diego Tourism Authority, and the city's overall STR occupancy runs around 60%, per AirDNA. But a beachfront condo two blocks from the Pacific Beach boardwalk performs nothing like an inland Carlsbad bungalow, and averaging them together in a market report is close to useless for underwriting a purchase or setting a nightly rate.
This guide breaks down which platforms genuinely deliver neighborhood-level demand and comp set data, where "neighborhood-level" is actually a ZIP code or a drawn radius in disguise, and how to build a defensible comp set for a San Diego property using the tools available in 2026.
What Platforms Actually Provide Neighborhood-Level STR Demand Data?
The platforms most commonly cited for neighborhood-level short-term rental demand and comp set analytics are AirDNA, Mashvisor, PriceLabs Market Dashboards, Key Data, AirROI, and Airbtics. Each pulls from a different data source, so their definitions of "neighborhood" and their geographic precision differ significantly.
Specifically, AirDNA covers global markets at the city, ZIP-code, and, in select markets, true neighborhood level, combining ADR, occupancy, and comp analytics into one dashboard. Mashvisor's documented API includes a dedicated /client/neighborhoods endpoint returning cap rate, cash-on-cash return, and demand indicators specifically at the neighborhood tier, though its documentation notes that not every neighborhood in every city has full coverage.
PriceLabs Market Dashboards, by contrast, builds comp sets from a radius you define, anywhere from 0.1 to 50 kilometers, rather than from a pre-drawn neighborhood boundary. That makes it flexible for San Diego's oddly shaped coastal ZIP codes, where the 92109 code alone (covering Pacific Beach and Mission Beach) accounted for roughly 30.24% of the city's active STR licenses in a retrieved open-data analysis. Key Data leans on verified reservation data from property managers rather than scraped listing estimates, which changes the accuracy conversation entirely, more on that below.
Which Tool Is Better, AirDNA or Airbtics?
AirDNA and Airbtics serve overlapping but distinct purposes: AirDNA is the broader-coverage platform built for city-to-ZIP-code analysis with a well-documented comp-set and Rentalizer tool, while Airbtics focuses more narrowly on investor-facing property-type and neighborhood drill-downs. Neither is objectively "better"; the right pick depends on whether you need broad market screening or granular investor underwriting.
AirDNA's advantage is scale and documentation. Its rental comps feature lets you build any number of comp sets with up to 100 comps each, matched within a 10-mile or 15-kilometer radius on bedrooms, bathrooms, and guest count. That radius-based matching works well in a market as compact as San Diego, where a 10-mile radius from Pacific Beach can reasonably capture La Jolla, Mission Beach, and parts of Clairemont without pulling in irrelevant inland data.
Airbtics markets itself around bedroom-count and neighborhood drill-downs that include regulations and guest-origin data alongside the standard ADR, occupancy, and revenue metrics. For an owner evaluating a single acquisition and wanting a fast property-type snapshot, that framing can be more digestible than AirDNA's broader dashboard. For an owner or manager tracking a portfolio across multiple San Diego neighborhoods, AirDNA's higher comp count ceiling and Rentalizer projection tool generally give you more to work with.
Is AirDNA a Reliable Source for STR Market Data?
AirDNA is widely regarded as one of the more reliable STR data sources because it aggregates scraped listing data across a large volume of markets and applies consistent methodology to occupancy, ADR, and revenue calculations. As of 2026, AirDNA reports San Diego's active listings at approximately 15,524, with 88% classified as entire-home rentals, and a citywide RevPAR of about $187.10, up 6% year over year.
Reliability, though, is not the same as precision at the street level. AirDNA's data is derived from public listing information rather than verified booking receipts, which means it estimates occupancy and revenue rather than confirming it directly from a property management system. That is a meaningful distinction from Key Data, which builds its benchmarks from verified reservation data supplied directly by property managers, plus hotel-performance data, giving it an edge in accuracy for owners who want confirmed numbers rather than modeled estimates.
For most San Diego owners, AirDNA's Rentalizer tool remains a reasonable starting point for underwriting. It searches comparable listings within a 10-mile or 15-kilometer radius, applies similarity matching on bedrooms, bathrooms, and guest count, and produces a weighted-average 12-month revenue, occupancy, and ADR projection assuming 365 days of availability. Notably, that "full availability" assumption inflates the number for owners who plan to block dates for personal use, so treat the Rentalizer output as a ceiling, not a guarantee.
What Is a Good AirDNA Market Score?
A good AirDNA Market Score generally falls in the upper range of the platform's scale, reflecting strong rental demand, healthy occupancy, and reasonable growth potential relative to supply. San Diego currently carries a Rental Demand score of 82 on AirDNA's Market Score system, as of a July 2026 reading, which places it firmly in the strong-demand category compared to many secondary U.S. markets.
That score does not mean every San Diego neighborhood performs equally. A Market Score is a citywide composite, blending occupancy, revenue growth, and seasonality across every ZIP code in the metro. Pacific Beach's 45% occupancy and $206 ADR for the trailing twelve-month period ending mid-2025 sits below the citywide 60% occupancy average AirDNA reports, largely because Pacific Beach's inventory skews toward smaller units and its seasonality is sharper, with July and June identified as the busiest months in the retrieved Pacific Beach dataset.
When you evaluate a Market Score, cross-reference it against neighborhood-level ADR and occupancy rather than treating the citywide number as predictive of your specific property. In our experience managing properties across Encinitas, Carlsbad, and Mission Beach, owners who rely solely on a citywide score tend to overprice inland units and underprice premium coastal ones, since the score smooths out exactly the variation that determines your actual nightly rate.

Is the Offer Sheet Legit? How to Validate Comp Set Data Before You Trust It
An "offer sheet" or comp set summary from any STR analytics platform is only as trustworthy as the data source behind it, and validating that legitimacy means checking whether the numbers come from scraped listing estimates, verified reservation data, or a blended methodology. Before you act on any comp set report, whether it comes from AirDNA, Mashvisor, or a third-party broker, ask the platform directly how it sources its occupancy and revenue figures.
Scraped-data platforms like AirDNA and Airbtics pull publicly visible calendar and pricing information from Airbnb and Vrbo listings, then model occupancy and revenue from availability patterns. This method scales well across 190-plus countries, as AirROI's platform documentation claims, but it can misread a listing that blocks dates for owner use as "unavailable" rather than "booked," inflating apparent occupancy.
Verified-data platforms like Key Data instead pull confirmed reservation records directly from property management systems, which removes the guesswork but limits coverage to properties whose managers have opted into data sharing. If a comp sheet looks unusually optimistic, especially one attached to a sales pitch for a property, ask specifically which of these two methods generated it, and request the underlying comp list rather than just the summary averages. A legitimate comp sheet should let you see each comparable listing individually, not just a blended output.
How Do You Build a Defensible Comp Set for a San Diego STR?
A defensible comp set is a group of at least 8 to 10 genuinely similar listings, matched on bedroom count, location proximity, quality tier, and guest capacity, used to benchmark a subject property's pricing and revenue potential. PriceLabs' own guidance recommends pulling the trailing 12 months of performance data and calculating a consistent set of metrics across every comp before drawing conclusions.
Building one properly in a San Diego coastal neighborhood requires more discipline than most owners apply. Follow this sequence:
Define your subject property's core attributes: bedroom and bathroom count, sleeping capacity, and whether it is a whole-home listing or a private room.
Set a geographic boundary that reflects true walkability and guest perception, not just a radius. A La Jolla Cove-adjacent condo and a listing eight blocks inland are not real comps, even if both fall inside a 2-mile radius.
Pull 8 to 10 comps minimum using AirDNA's Comp Sets feature or PriceLabs' custom filters, which allow more than 40 filter combinations including amenities and review ratings.
Remove outliers, listings with unusually low review counts, recently delisted properties, or units advertising amenities (private pools, rooftop decks) your subject property lacks.
Calculate average occupancy, ADR, RevPAR, and booking window across the remaining set, then compare your subject property's trailing performance against that average to find your RevPAR gap.
Techvestor's underwriting approach adds a layer most owners skip: evaluating demand-driver proximity, walkability, and target-guest fit alongside the raw revenue numbers, rather than chasing the highest gross revenue comp in the set. A comp that outperforms because it sits directly on the boardwalk is not a fair benchmark for a unit six blocks away, even if the bedroom count matches exactly.
What's the Difference Between City, ZIP Code, Radius, and True Neighborhood Data?
City-level, ZIP-code-level, radius-based, and true neighborhood-level analytics represent four distinct geographic precisions, and most platforms marketed as "neighborhood analytics" actually deliver one of the first three while using neighborhood language loosely. Understanding which one you're looking at prevents costly misreads of your comp set.
Geographic Level | What It Actually Measures | Where It Falls Short in San Diego |
City-level | Aggregates every listing across San Diego into one occupancy, ADR, and revenue average | Blends Pacific Beach's 45% occupancy with citywide 60% occupancy, masking real variation |
ZIP-code-level | Groups listings by postal code, such as 92109 for Pacific Beach and Mission Beach | ZIP boundaries don't match STRO license tiers; 92109 spans both Tier 3 and Tier 4 zones |
Radius-based | Pulls comps within a user-defined distance, commonly 10 miles on AirDNA or 0.1 to 50 km on PriceLabs | A fixed radius from a coastal address can pull in inland comps that don't share the same demand drivers |
True neighborhood-level | Uses drawn or pre-set boundaries matching how locals and guests actually perceive an area | Rarely available consistently; Mashvisor and Airbtics offer it in select markets only, per their own documentation |
In practice, we tell owners to treat radius-based tools like AirDNA and PriceLabs as the working default, since they're the most consistently available, but to manually tighten the radius or draw a custom polygon (available through AirROI's lasso search mode) whenever a coastal or tourist-heavy submarket has sharp internal variation, which Pacific Beach and La Jolla both do.
How Do Comp Set Platforms Handle Seasonality and Forward Demand?
Comp set platforms track seasonality by analyzing booking pace, calendar availability, and historical occupancy patterns across a trailing 12-month window, then some extend that into forward-looking demand signals based on current booking activity. This matters enormously in San Diego, where seasonal swings are sharp along the coast but far gentler inland.
For example, Pacific Beach's retrieved seasonal estimates show summer occupancy exceeding 75% while winter occupancy commonly falls to 40% to 50%, a swing of roughly 25 to 35 percentage points across the year. A comp set tool that only reports a trailing-12-month average will hide that swing entirely, which is a problem if you're pricing for an upcoming July weekend using an annualized number.
AirDNA's forward-looking features and Key Data's daily pricing and availability monitoring on Airbnb and Vrbo are both built to surface booking pace ahead of the stay date, rather than just historical averages. Additionally, Key Data's quarterly index, drawing on data from hundreds of thousands of U.S. properties as of its August 2026 release, is specifically designed to give property managers and destination marketing organizations a demand trendline rather than a single static snapshot. If your comp set tool only shows you last year's numbers, you're pricing in the rearview mirror during a market where California's overall visitor spending is forecast to grow 4.8% in 2026, per Visit California and Tourism Economics.

What Should You Prioritize When Choosing a Comp Set Platform?
Prioritize data source transparency, geographic flexibility, and comp count limits over brand recognition when choosing a comp set platform, since these three factors determine whether the output actually applies to your specific San Diego property. A well-marketed dashboard with vague sourcing is less useful than a smaller tool that tells you exactly where its numbers come from.
Common mistakes we see owners make include treating a citywide Market Score as a pricing benchmark, building comp sets with fewer than 8 listings, and ignoring whether comps are professionally managed or self-managed. A professionally managed comp with dynamic pricing and 24/7 guest response will consistently outperform a self-managed comp with identical bedrooms and location, and blending the two into one average understates what a well-run listing can achieve.
Trade-offs worth understanding before you commit to a paid subscription:
Scraped-data platforms (AirDNA, Airbtics, AirROI) offer broader coverage but model rather than confirm occupancy and revenue.
Verified-data platforms (Key Data) offer higher accuracy but narrower coverage, since they depend on manager participation.
API-driven platforms (Mashvisor) integrate well into larger investment workflows but require more technical setup than a simple dashboard.
Radius-based tools (PriceLabs, AirDNA) give you control over geography but require you to manually adjust for submarket variation.
Most gated features, including saved comp sets, forward-demand views, and API access, sit behind paid subscription tiers on nearly every platform in this space. Confirm which specific features (custom comp sets, neighborhood drill-downs, API endpoints) are actually included at your plan level before assuming a tool covers what you need; pricing tiers and feature gates change frequently enough that the vendor's own site is the only reliable source to check.
How Should You Reconcile Conflicting Data Across Platforms?
Reconciling conflicting comp set data across platforms means building a downside, base, and upside case rather than trusting a single number, since AirDNA, Key Data, and Mashvisor will rarely agree exactly on occupancy or revenue for the same address. This is the step most owners skip entirely, and it's where a lot of bad purchase decisions originate.
Start by pulling the same property through two platforms with different data sources, ideally one scraped-data tool and one verified-reservation tool if you have access. Where the numbers diverge by more than 10 to 15%, treat the lower figure as your downside case and the higher as your upside case, then adjust both for factors no platform accounts for automatically: planned owner-use blocks, HOA restrictions, and the property's actual condition versus its comps.
From what we've seen managing properties that switch between short-term and mid-term strategies across San Diego's coastal neighborhoods, the biggest reconciliation error owners make is forgetting to discount for blocked nights. A comp set tool assuming 365 days of availability will always overstate revenue for an owner who plans to use the property personally for even two or three weeks a year. Build your base case around your actual available nights, not the platform's default assumption, and you'll land much closer to what the property will really earn.
Frequently Asked Questions
Which platforms provide neighborhood-level demand and comp set analytics for STRs?
AirDNA, Mashvisor, PriceLabs Market Dashboards, Key Data, AirROI, and Airbtics are the platforms most commonly used for STR demand and comp set analytics, though only some offer true neighborhood boundaries rather than ZIP-code or radius-based approximations. AirDNA and PriceLabs are the most widely adopted for San Diego coastal markets due to their comp count flexibility and radius controls.
Is it worth evaluating a revenue management company like AirDNA on seasonal and event-based demand forecasting?
Yes, seasonal and event-based forecasting is one of the more important criteria to evaluate, since a platform that only reports trailing 12-month averages will hide sharp swings like Pacific Beach's summer occupancy exceeding 75% against winter occupancy near 40% to 50%. AirDNA's forward-looking demand data and Key Data's daily monitoring on Airbnb and Vrbo both address this gap better than a static annual dashboard.
Is AirDNA a reliable source?
AirDNA is widely used and considered reliable for broad market screening, citing figures like San Diego's approximately 15,524 active listings and 60% average occupancy. Its data is modeled from scraped listing information rather than confirmed reservations, so treat it as a strong directional benchmark rather than an exact accounting of any single property's performance.
What is a good AirDNA Market Score?
A Market Score in the 75 to 100 range generally signals strong rental demand relative to other U.S. markets; San Diego currently sits at 82 for Rental Demand as of mid-2026. A high citywide score does not guarantee strong performance in every neighborhood, since it averages across submarkets with very different seasonality and occupancy.
What neighborhood should you stay in when visiting San Diego?
Pacific Beach suits travelers who want boardwalk access and nightlife within walking distance, while La Jolla fits those prioritizing quieter coastal views and upscale dining. Mission Beach works well for larger groups wanting bay and ocean access on a narrow peninsula, and North County areas like Encinitas and Carlsbad offer a slower pace with strong surf culture.
What's the vibe like in different San Diego neighborhoods, and which ones are good?
Pacific Beach has an energetic, younger crowd centered around Garnet Avenue and the boardwalk, while La Jolla leans more upscale and residential with cove views and tide pools. Mission Beach is dense and lively in summer with a classic beach-town feel, and Carlsbad and Encinitas trend toward families and surfers with a calmer, small-town coastal atmosphere. Each neighborhood's STR demand pattern tends to follow its guest profile, so matching a property's design and pricing to that specific vibe matters for booking performance.
What separates a top-performing STR listing from an average one in the same comp set?
Top-performing listings within an identical comp set typically differ on review volume and rating consistency, photo quality, response time, and whether pricing is actively managed versus set once and left alone. A professionally managed listing with dynamic pricing and consistent 24/7 guest communication will usually outperform a similar self-managed unit even when bedroom count and location are identical.
Getting Neighborhood-Level STR Data Right in 2026
No single platform delivers perfect neighborhood-level demand and comp set data everywhere, which is why the strongest approach in 2026 combines a radius-based tool like AirDNA or PriceLabs with a manually built comp set of 8 to 10 genuinely comparable listings, cross-checked against a second data source where possible. San Diego's Rental Demand score of 82 and citywide 60% occupancy are useful starting points, but they mean little for a specific Pacific Beach or La Jolla address without submarket-level verification.
The owners who consistently outperform their comp set aren't relying on a single dashboard. They're pulling data from multiple sources, discounting for blocked nights and owner use, and adjusting for the seasonal swings that citywide averages smooth over. That process takes real time each month, time most owners don't have alongside a job, a family, or a second property.
If reconciling comp set data, adjusting for San Diego's neighborhood-level seasonality, and translating raw analytics into an actual pricing strategy sounds like more than you want to manage yourself, West Coast Homestays builds that analysis into its revenue management process for owners across Pacific Beach, La Jolla, Encinitas, Carlsbad, Oceanside, and Mission Beach. Our team has driven revenue increases of $121,000 and counting for owners who assumed their pricing was already optimized, and our hybrid STR and mid-term rental strategies have produced results running 39% to 66% above comp set revenue for select properties.

If you'd like a professional review of how your property compares to its actual neighborhood comp set rather than a citywide average, get started with West Coast Homestays for a data-backed look at where your revenue gaps really are. You can also explore our Pacific Beach Airbnb management services or review broader strategy guidance in our dynamic pricing guide for San Diego rentals.
Written by Mark Palmiere, Owner & CEO at West Coast Homestays
Content powered by inkSTR.co


Comments